
Match Score

New Orleans Pelicans

Toronto Raptors
T
Q1
Q2
Q3
Q4
126
40
34
28
24
108
29
18
31
30
Game Statistic
52.3%
Field Goals Percentage
47.7%
Two Point Shot Counts
Three Point Shot Counts
Three Point Shooting
Field Goals Made
Number of Shots
Free Throw Made
Free Throws
Free Throw Percentage
Timeout
Offensive Rebound
Defensive Rebound
Total Rebounds
Assist
Blocks
Turnovers
Fouls
Two Points
Three Points
New Orleans Pelicans
#
Starting Line Up
MIN
▲PTS
▲REB
▲AST
▲STL
▲BLK
▲FGM
▲FGA
▲FG%
▲3PM
▲3PA
▲3P%
▲FTM
▲FTA
▲FT%▲
OFF
▲DEF
▲15
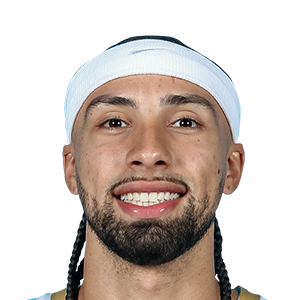
Jose Alvarado
27
4
2
5
2
0
1
4
25.0
0
1
0.0
2
2
100.0
1
1
5

Herbert Jones
20
12
4
1
0
0
4
9
44.4
2
5
40.0
2
2
100.0
1
3
17

Jonas Valanciunas
26
16
13
3
0
0
6
12
50.0
2
5
40.0
2
2
100.0
2
11
25
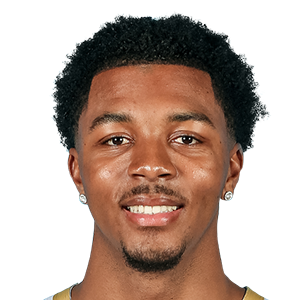
Trey Murphy III
37
26
5
1
1
1
8
17
47.1
6
12
50.0
4
4
100.0
1
4
1
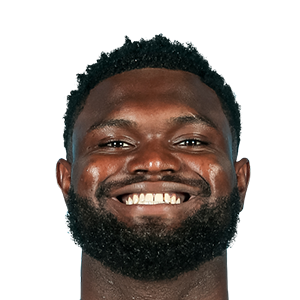
Zion Williamson
37
33
10
5
4
2
12
15
80.0
0
0
0.0
9
12
75.0
3
7
#
Substitution
MIN
▲PTS
▲REB
▲AST
▲STL
▲BLK
▲FGM
▲FGA
▲FG%
▲3PM
▲3PA
▲3P%
▲FTM
▲FTA
▲FT%▲
OFF
▲DEF
▲-
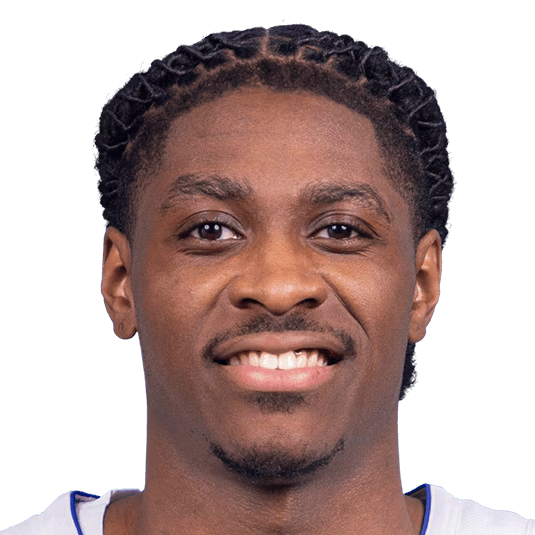
Dereon Seabron
0
0
0
0
0
0
0
0
0.0
0
0
0.0
0
0
0.0
0
0
10
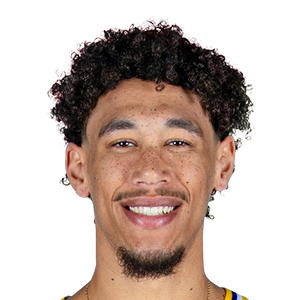
Jaxson Hayes
0
0
0
0
0
0
0
0
0.0
0
0
0.0
0
0
0.0
0
0
13

Kira Lewis Jr
0
0
0
0
0
0
0
0
0.0
0
0
0.0
0
0
0.0
0
0
4
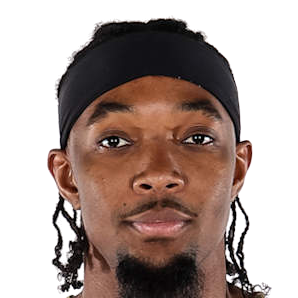
Devonte Graham
20
2
1
2
0
0
0
6
0.0
0
5
0.0
2
2
100.0
0
1
41

Willy Hernangomez
11
4
3
1
0
0
2
4
50.0
0
0
0.0
0
0
0.0
0
3
41
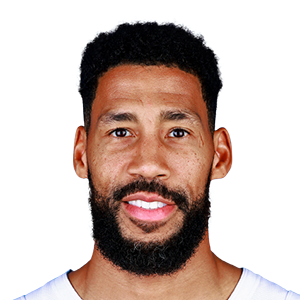
Garrett Temple
11
5
1
0
1
0
2
3
66.7
1
1
100.0
0
0
0.0
1
0
22

Larry Nance Jr.
20
10
5
1
1
1
4
7
57.1
2
2
100.0
0
0
0.0
1
4
11
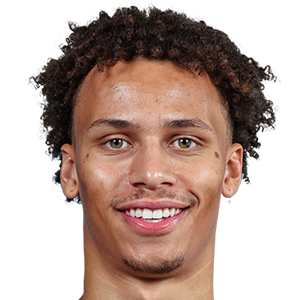
Dyson Daniels
31
14
8
9
1
0
6
9
66.7
1
2
50.0
1
2
50.0
2
6
Toronto Raptors
#
Starting Line Up
MIN
▲PTS
▲REB
▲AST
▲STL
▲BLK
▲FGM
▲FGA
▲FG%
▲3PM
▲3PA
▲3P%
▲FTM
▲FTA
▲FT%▲
OFF
▲DEF
▲23
Fred Vanvleet
20
2
6
6
1
0
1
8
12.5
0
7
0.0
0
0
0.0
0
6
21

Thaddeus Young
15
2
1
1
1
0
1
2
50.0
0
0
0.0
0
0
0.0
0
1
4

Scottie Barnes
21
4
1
5
1
1
1
7
14.3
1
5
20.0
1
2
50.0
0
1
3

OG Anunoby
31
12
5
3
1
1
5
11
45.5
1
3
33.3
1
1
100.0
0
5
43
Pascal Siakam
34
23
6
4
2
2
9
16
56.3
1
2
50.0
4
5
80.0
2
4
#
Substitution
MIN
▲PTS
▲REB
▲AST
▲STL
▲BLK
▲FGM
▲FGA
▲FG%
▲3PM
▲3PA
▲3P%
▲FTM
▲FTA
▲FT%▲
OFF
▲DEF
▲20

Jeff Dowtin
3
0
0
0
0
0
0
0
0.0
0
0
0.0
0
0
0.0
0
0
22

Malachi Flynn
3
0
0
2
0
0
0
1
0.0
0
1
0.0
0
0
0.0
0
0
24

Khem Birch
5
2
0
0
0
0
1
1
100.0
0
0
0.0
0
0
0.0
0
0
25

Chris Boucher
26
6
2
0
1
1
2
6
33.3
0
3
0.0
2
4
50.0
0
2
35

Christian Koloko
18
6
2
0
0
2
3
3
100.0
0
0
0.0
0
0
0.0
0
2
45
Dalano Banton
9
7
3
4
2
0
3
7
42.9
1
3
33.3
0
0
0.0
0
3
41

Juancho Hernangomez
23
9
3
3
0
0
4
6
66.7
1
3
33.3
0
0
0.0
1
2
33
Gary Trent Jr.
33
35
1
1
3
0
12
20
60.0
6
11
54.5
5
7
71.4
0
1
New Orleans Pelicans
Toronto Raptors
Support Your Team
0%
New Orleans Pelicans
0%
Toronto Raptors
Team Form
New Orleans Pelicans
L
W
W
L
W
Toronto Raptors
W
L
L
W
W
Head to head

Recent Results
New Orleans Pelicans
Moneyline
Moneyline
Spread
O/U
O/U
Toronto Raptors
Moneyline
Moneyline
Spread
O/U
O/U
Eastern Conference
| # | Team | W:L | STR | L10 | PPG | OPPG |
|---|---|---|---|---|---|---|
| 1 | Milwaukee Bucks  | 58:24 | -2 | 6:4 | 116.9 | 113.3 |
| 2 | Boston Celtics  | 57:25 | 3 | 8:2 | 117.9 | 111.4 |
| 3 | Philadelphia 76ers  | 54:28 | 2 | 5:5 | 115.2 | 110.9 |
| 4 | Cleveland Cavaliers  | 51:31 | -1 | 7:3 | 112.3 | 106.9 |
| 5 | New York Knicks  | 47:35 | -2 | 5:5 | 116 | 113.1 |
| 6 | Brooklyn Nets  | 45:37 | -1 | 6:4 | 113.4 | 112.5 |
| 7 | Atlanta Hawks  | 41:41 | -2 | 5:5 | 118.4 | 118.1 |
| 8 | Miami Heat  | 44:38 | 1 | 6:4 | 109.5 | 109.8 |
| 9 | Toronto Raptors | 41:41 | 1 | 6:4 | 112.9 | 111.4 |
| 10 | Chicago Bulls  | 40:42 | 2 | 6:4 | 113.1 | 111.8 |
| 11 | Indiana Pacers  | 35:47 | 1 | 3:7 | 116.3 | 119.5 |
| 12 | Washington Wizards  | 35:47 | -1 | 3:7 | 113.2 | 114.4 |
| 13 | Orlando Magic  | 34:48 | -4 | 5:5 | 111.4 | 114 |
| 14 | Charlotte Hornets  | 27:55 | 1 | 5:5 | 111 | 117.2 |
| 15 | Detroit Pistons  | 17:65 | -1 | 1:9 | 110.3 | 118.5 |
Western Conference
| # | Team | W:L | STR | L10 | PPG | OPPG |
|---|---|---|---|---|---|---|
| 1 | Denver Nuggets  | 53:29 | 1 | 5:5 | 115.8 | 112.5 |
| 2 | Memphis Grizzlies  | 51:31 | -1 | 6:4 | 116.9 | 113 |
| 3 | Sacramento Kings  | 48:34 | -3 | 5:5 | 120.7 | 118.1 |
| 4 | Phoenix Suns  | 45:37 | -2 | 7:3 | 113.6 | 111.6 |
| 5 | LA Clippers  | 44:38 | 3 | 6:4 | 113.6 | 113.1 |
| 6 | Golden State Warriors  | 44:38 | 3 | 8:2 | 118.9 | 117.1 |
| 7 | LA Lakers  | 43:39 | 2 | 8:2 | 117.2 | 116.6 |
| 8 | Minnesota Timberwolves  | 42:40 | 3 | 7:3 | 115.8 | 115.8 |
| 9 | New Orleans Pelicans | 42:40 | -1 | 7:3 | 114.4 | 112.5 |
| 10 | Oklahoma City Thunder  | 40:42 | 2 | 4:6 | 117.5 | 116.4 |
| 11 | Dallas Mavericks  | 38:44 | -2 | 2:8 | 114.2 | 114.1 |
| 12 | Utah Jazz  | 37:45 | -1 | 2:8 | 117.1 | 118 |
| 13 | Portland Trail Blazers  | 33:49 | -4 | 1:9 | 113.4 | 117.4 |
| 14 | Houston Rockets  | 22:60 | 3 | 4:6 | 110.7 | 118.6 |
| 15 | San Antonio Spurs  | 22:60 | 1 | 3:7 | 113 | 123.1 |
Related News
เกี่ยวกับเรา
GoalDaddy TV เป็นหนึ่งในช่องรายการฟุตบอลและถ่ายทอดสดกีฬาฟรี ไฮโลท์บอล ตารางบอล ผลบอลสด ที่มีชื่อเสียงโด่งดังที่สุด ช่องนี้เป็นเหมือนสวรรค์สำหรับผู้ที่ชื่นชอบความบันเทิง โดยนำเสนอเนื้อหาที่ยอดเยี่ยมพร้อมด้วยความตื่นเต้นและคุณภาพสูง
GoalDaddy TV เป็นชื่อที่คุ้นเคยในวงการถ่ายทอดสดฟุตบอลฟรี และเป็นที่รู้จักกันอย่างยาวนานว่าเป็นจุดหมายปลายทางสูงสุดสำหรับแฟนฟุตบอลตัวยงทั่วโลก ช่องนี้มีชื่อเสียงในด้านภาพที่คมชัดและสดใสระดับ 4k ทีมนักข่าวผู้เชี่ยวชาญด้านกีฬา และคลังข้อมูลการแข่งขันที่น่าตื่นเต้น ช่องนี้ได้ครองตำแหน่งผู้นำอย่างมั่นคงในการมอบประสบการณ์ที่หลากหลายแก่ผู้ชมในการติดตามการแข่งขันฟุตบอลระดับสูงสุด เช่น ยูฟ่าแชมเปียนส์ลีก ฟุตบอลโลก พรีเมียร์ลีก ลาลีกา บุนเดสลีกา กัลโช่ เซเรียอา และการแข่งขันชิงแชมป์ในรายการสำคัญระดับประเทศหลายรายการ รวมไปถึงดูบอลออนไลน์สดฟรีทีมที่ชอบ ทีมที่เชียร์ได้ทุกคู่ แมนยู ลิเวอร์พูล เชลซี อาเซน่อล อัพเดทลิงค์ดูบอลตลอดแบบเรียลไทม์ บทความนี้จะพาคุณไปสำรวจภารกิจหลัก ประวัติศาสตร์อันยาวนาน และรากฐานแห่งความแข็งแกร่งที่ทำให้ GoalDaddy TV ขึ้นสู่ตำแหน่งผู้นำในการส่งมอบความสุขและความตื่นเต้นให้กับแฟนบอล
Follow Us